CoffeeScript Source Maps
By Ryan Florence, published 2012-09-07
Michael Ficarra’s successful kickstarter to create a “better CoffeeScript compiler” is already paying some huge dividends to the backers with source maps. Debugging CoffeeScript, the most popular and strongest argument for not using it in the browser, is now 90% solved.
Try it out yourself, what you’ll need:
- Google Chrome
- CoffeeScriptRedux
Installing CoffeeScriptRedux
Clone it from github:
$ git clone git://github.com/michaelficarra/CoffeeScriptRedux.git
Install the dependencies:
$ cd CoffeeScriptRedux
$ make deps
Run the tests to make sure its all happy:
$ make test
Compile your file to JS
CoffeeScriptRedux doesn’t use the same interface as the original coffeescript, so this is a bit different than what you’re probably used to.
From the CoffeeScriptRedux directory:
$ ./bin/coffee --js -i /path/to/test.coffee
That’ll create /path/to/test.js.
Create the Source Map File
$ ./bin/coffee --source-map -i /path/to/test.coffee > /path/to/test.js.map
I had to install the source-map npm module for it to work.
$ npm install source-map
Tell the Browser About the Source Map
You need to tell the browser where your source map is by adding a comment to the file, you can open test.js up in an editor or just run this:
$ (echo; echo '//@ sourceMappingURL=test.js.map') >> /path/to/test.js
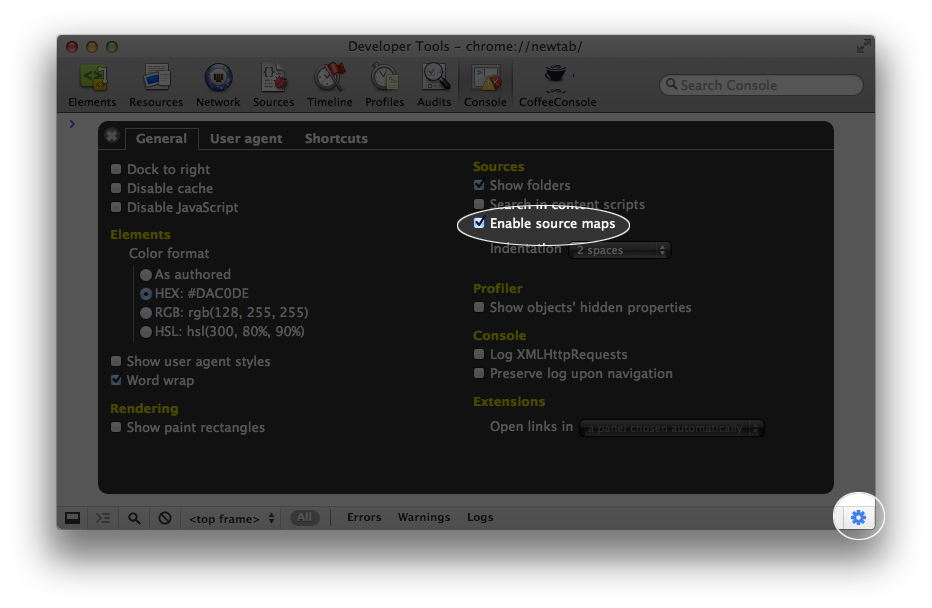
Fire up Chrome and Enable Source Maps
Open the console, click the gear at the bottom right, click the “Enable Source Maps” checkbox.
That’s it!
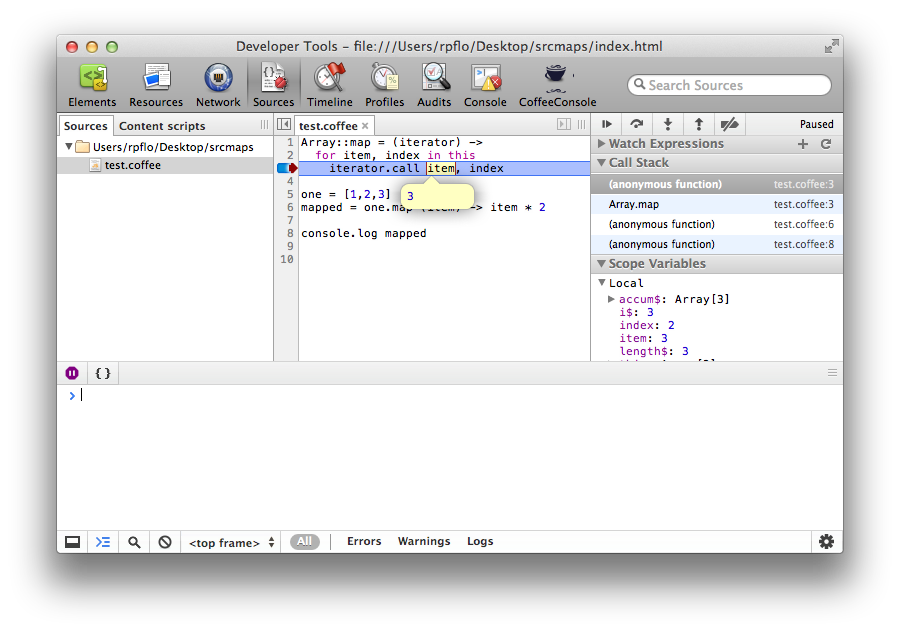
When you go to “Sources” in web inspector for a web page that includes test.js it will now show your CoffeeScript source files where you can set break points, hover variables to see their values, etc.
Here’s me debugging a purposefully broken map implementation:
So What is the 10% Not Solved?
Well, you can’t type CoffeeScript into the console. There is the CoffeeConsole chrome plugin, but that doesn’t know anything about being paused in a break point, etc.
